Big Picture Macro
The USD Inflation Doom Loop

KISS - Keep it simple, stupid
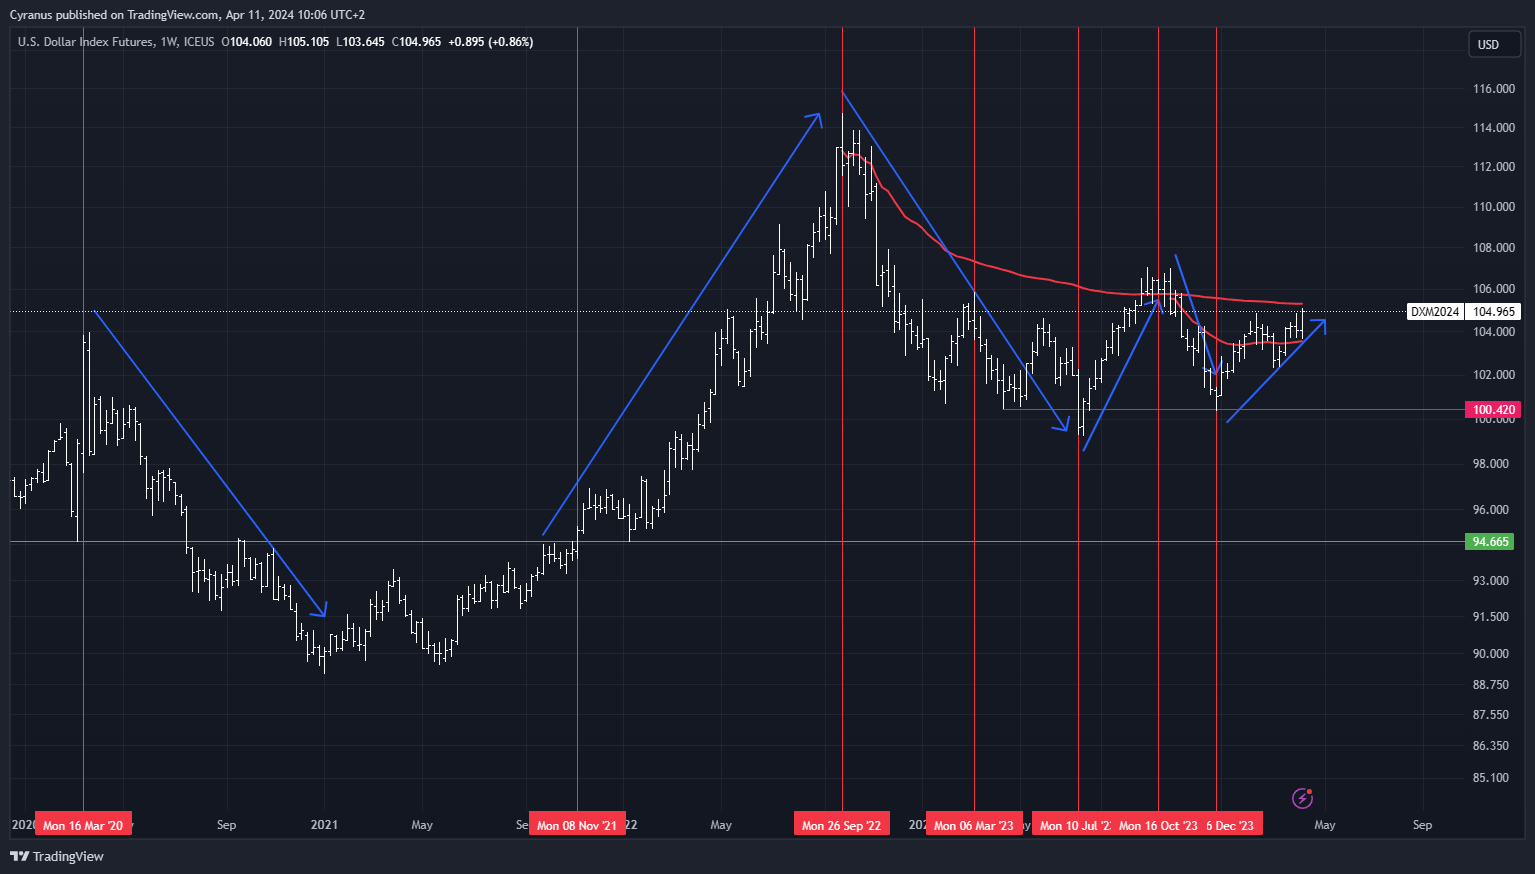
With this chart in USD we can easily explain all major macro moves since 2020.
If we have the right framework, for me that framework is:
USD up = Interest rates up = Everything else down.
Why?
Because we are in a highly leveraged system based on the USD… meaning we have much more debt than actual currency, this debt has largely flown into asset prices, so if the USD and interest rates rise, people have to sell assets to serve their debt.
(won´t get into the details of the Euro Dollar system here, but basically all debt that exists, is in some form anchored in USD, even if not all debt is given out by US institutions, or even US banks)
Example: USD spike in march 2020 = giant margin calls and everything gets sold.
Then: FED intervenes and prints many USD and buys debt (public and private), USD devalues and asset prices rise.
This is a nice trick to prevent a deleveraging and a global margin call.
Inflation = The hair in the soup
In 2020 central banks and governments might have overdone it a little bit with printing money, creating inflation (consumer price inflation, not just asset price inflation which is actually very much welcome)
Inflation is widely unpopular with the people, so policy makers should aim to keep it under control.
How do you bring inflation down?
You make money more expensive by raising rates, which brings down private sector lending and then slows the economy.
The problem: Public debt and fiscal spending
This is where it gets interesting now:
If US government debt is too high, raising rates might actually be stimulative, as the interest payments (1,6trillion USD calculated for 2024), will actually put more money into the private sector, while the government debt is getting squeezed.
This effect is getting enhanced by the following factors:
private debt has a longer maturity than public debt, as companies and private households took out big loans for multiple decades, while rates where at or below zero
government has not done that and has to refinance now with much higher interest rates
many private companies and private households are sitting on piles of cash, that they now loan out to the US government
Public debt squeeze
2022 was the year, the flight to safety asset falied and when equities sold off, bonds sold off even more. Which threatens the ability to refinance the government debt.
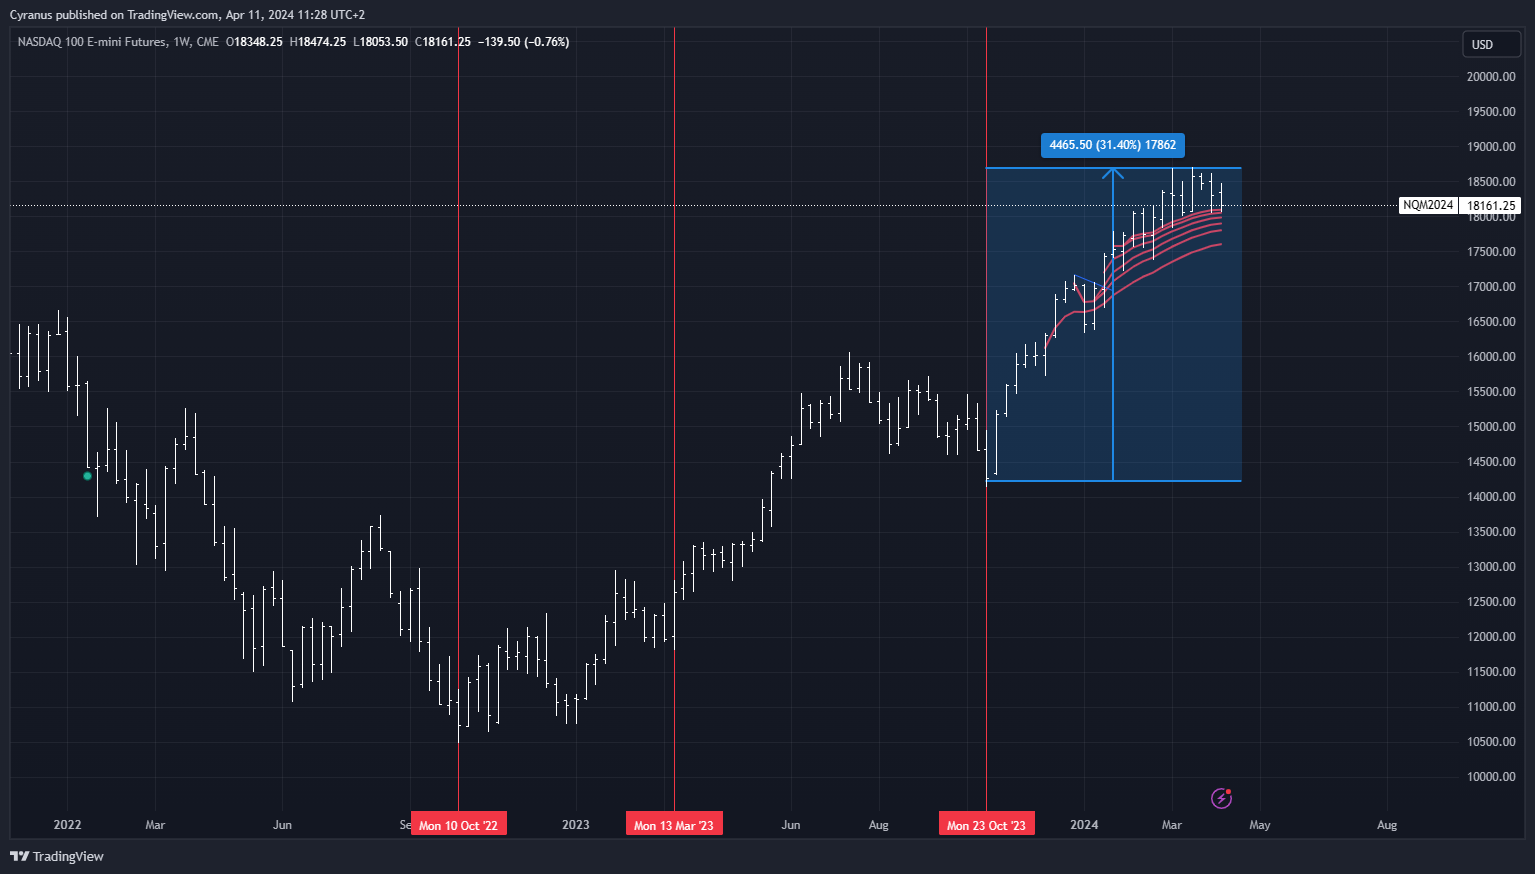
Policy makers have made that delicate experience and acted in a predictable way in october 2022, march 2023 and again in november 2023.
All of these instances mark major tops in the USD chart as shown above, they also mark the starting points for pretty strong equity rallies:
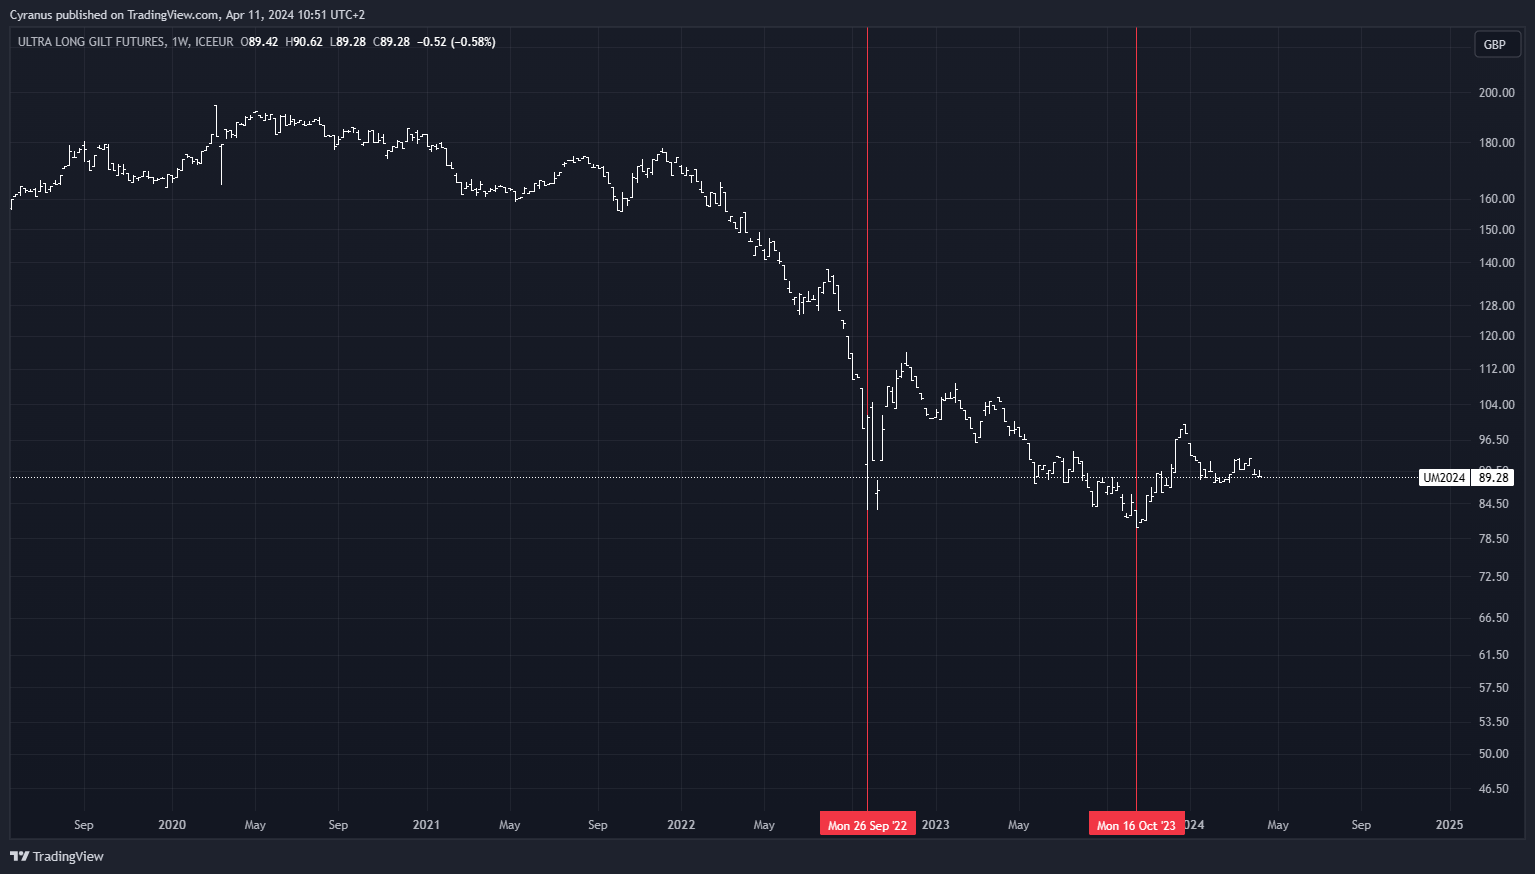
october/sepember 2022: major spike in treasury volatility and a blow up in in the UK gilt market… UK almost went bankrupt with major margin calls coming in for overleveraged pension funds that where invested in those UK gilts, which got resolved by the Bank of England through buying up those gilts and the UK government reversing on their spending plans, which also ended some careers.
On the US side treasury secretary Yellen ran down the TGA (basically the US governments checking account) to stop Bond prices from falling and the USD from rising, and it worked.
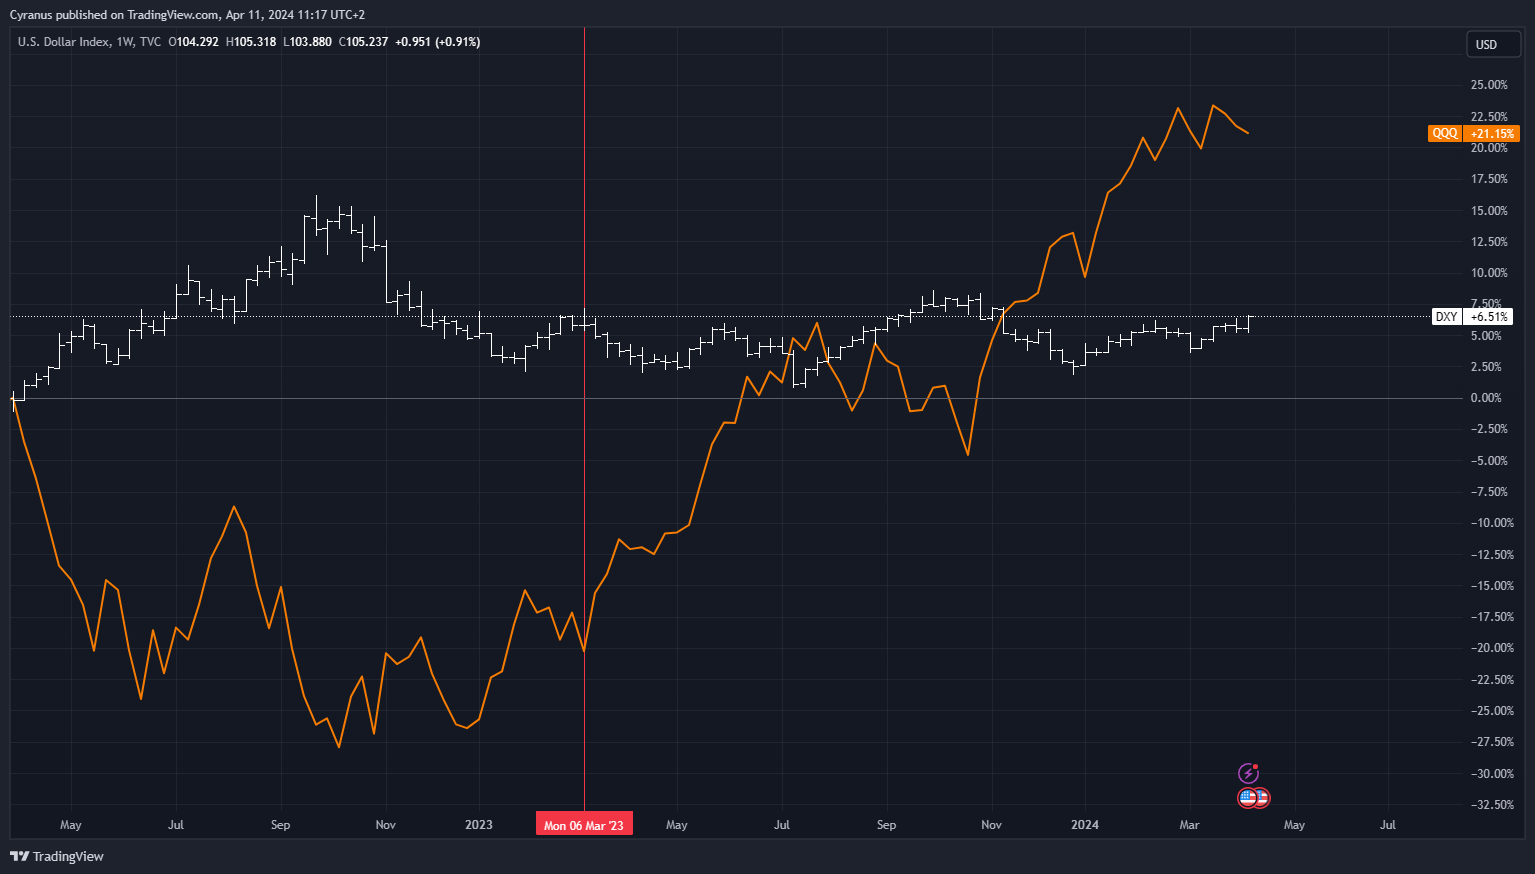
march 2023: Regional Bank crisis: the banks that had bought big amounts of US bonds, especially in the long end, are sitting on massive paper losses. Those regional banks that also were highly leveraged in commercial real estate and/or basically funded tech start ups in silicon valley, where they loaned out huge amounts of money for very little interest, were inable to pay out their depositors, who on the search for yield transferred their capital into US money market funds went bust, so the US government jumped in and bailed out private depositors to prevent a contagious bank run, this further widened the gap between public debt and private cash holdings and massively injected liquidity into the system, as can be seen in the DXY and QQQ chart below:
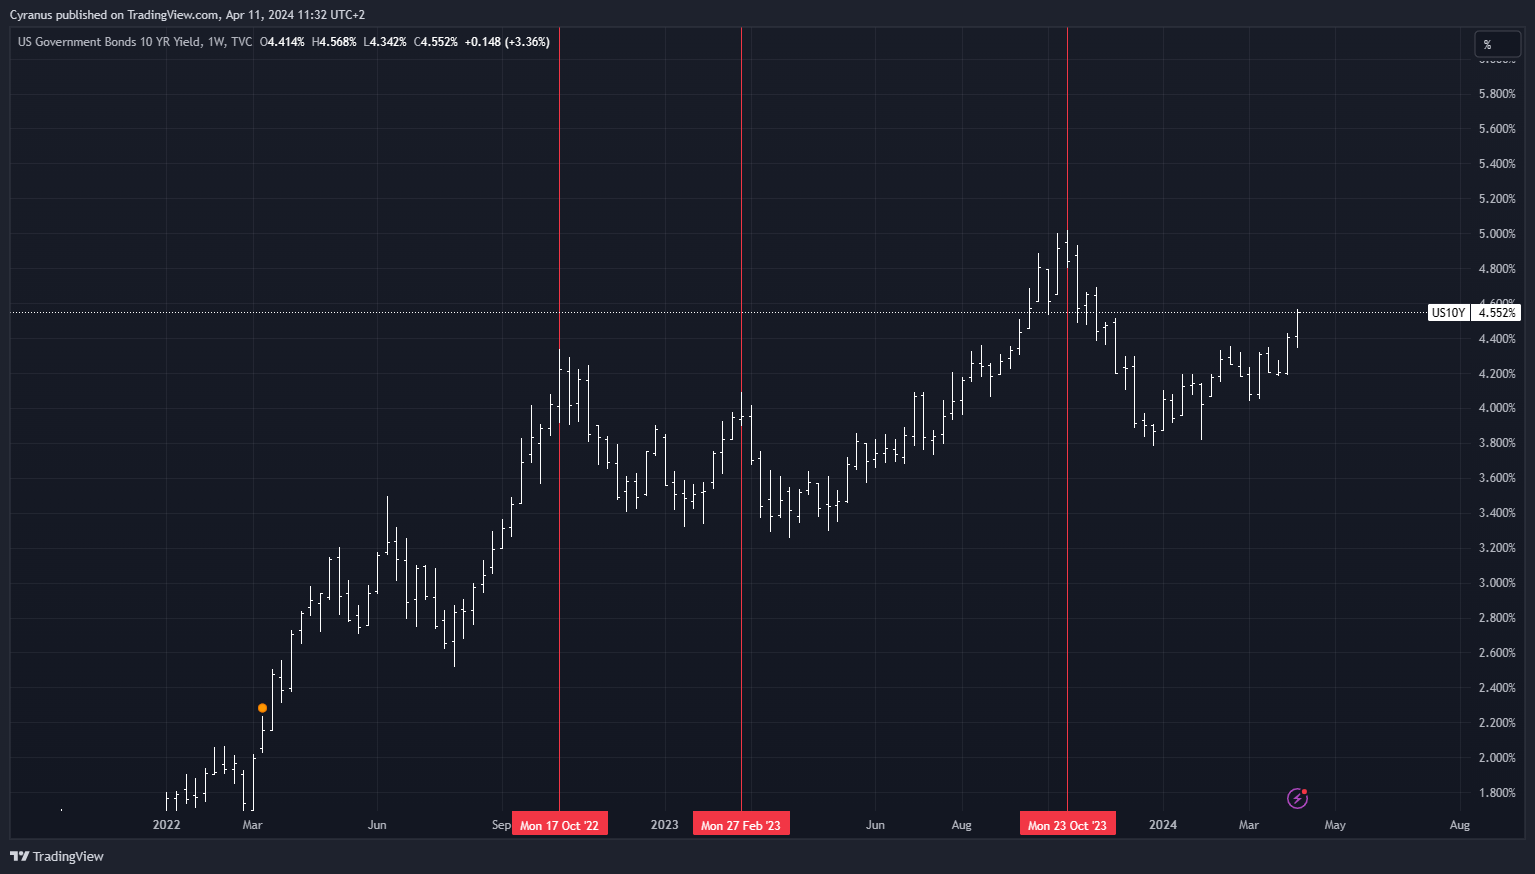
october 2023 - rising yields and a failed treasury auction forced the hand of Yellen and Powell. The economy wasnt slowing down despite the fastest rate hike cycle in history and nobody wanted to buy the long end of treasuries, so Yellen had to jump in and sell more short end bonds, to limit the supply of long end bonds, while Powell came out to talk rates down, declaring victory over inflation and promising rate cuts in 2024… rates plummeted, market priced in 6 rate cuts and the Nasdaq 100 went on a quick 30% lock out rally, that is just now fizzling out.
Rates and USD rising
In a frustrating plot twist, equities keep ralling harder than bonds.
Apparently it takes continuing efforts by the treasury and the FED to keep the USD and rates down, but they just keep rebounding
This might lead to the next crisis in pubic debt, which requires further intervention to keep the rates down, which leads to another strong equity rally?
At the same time, inflation has picked up again, evident by the CPI rising again month over month and the rally in (precious) metals and oil since late january.
This is due to the economy not slowing down, and the liquidity increasing through the actions by the Treasury and the FED.
This leads to a possible Doom Loop:
Inflation → Higher USD/Rates
→ stimulative for US economy and squeeze on public debt
→ liquidity injections to save the system (US or Uk or other governments)
→ USD down and rates down
→ higher equity and commodity prices
→ higher inflation
→ Higher USD/Rates
Macro Tourism
Now to be fair I am just a macro tourist, I don´t really know whats happening, and I much less know what will happen in the future.
This was just a way of writing down my thoughts and maybe a start for a more serious discussion about macro and what really happens beneath the curtain.
I will open up my Substack chat and especially welcome challenges to my macro “theory”