
Weekly Macro Analysis 11.08.24
Rebound Attempt

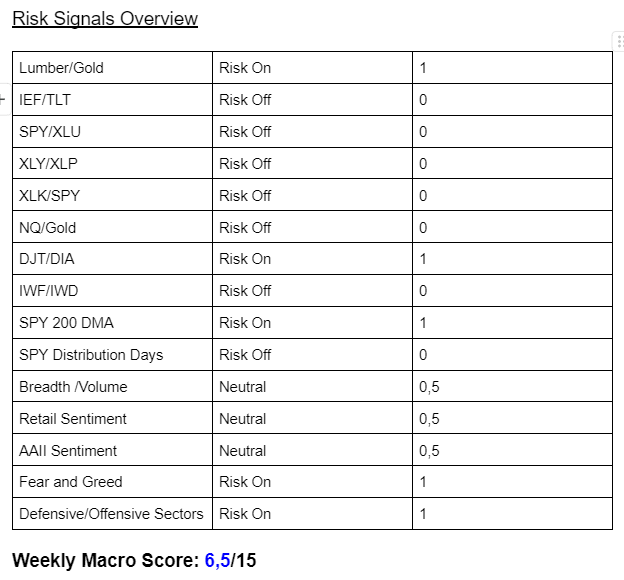
Last week was a very clear picture in my risk signals to stay cautious of increased volatility and we got it.
We had a big and scary downside day o monday, tht did get bougth up quickly.
Then we chopped around and ended the week right where we closed the prior week.
Monday was a big scare with the Nikkei and the Yen Carry Trade, not an expert but here is a quick explanation:
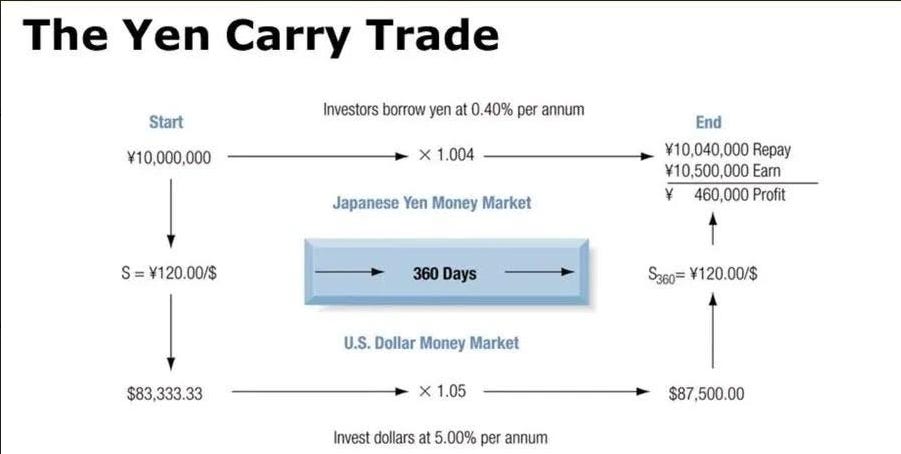
When Risk assets fell, because of a liquidity crunch due to the Carry Trade unwind Risk Off Assets rallied hard: TLT, CHF and JPY.
But they did get sold after the spike on monday. So we might have seen the worst of it and found a bottom with the pre market capitulation.
That is also suggested by the leaders and laggards of this weeks rebound:
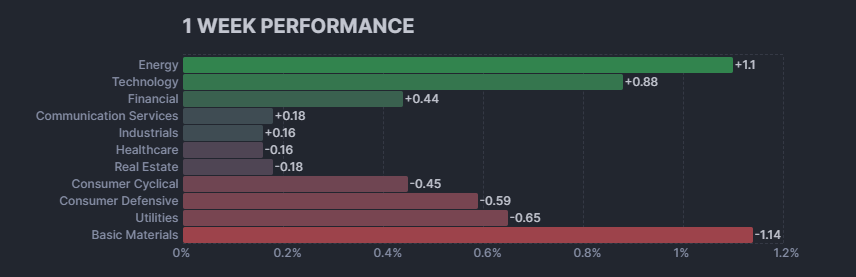
Especially the bottom sectors Utilites and Staples underperforming gives me some hope that we might have indeed seen the bottom.
Yet there are still some compelling arguments for more sustained volatility:
We did a lot of technical damage to the charts and need to overcome stiff resistance above. (will chart this out later in the report)
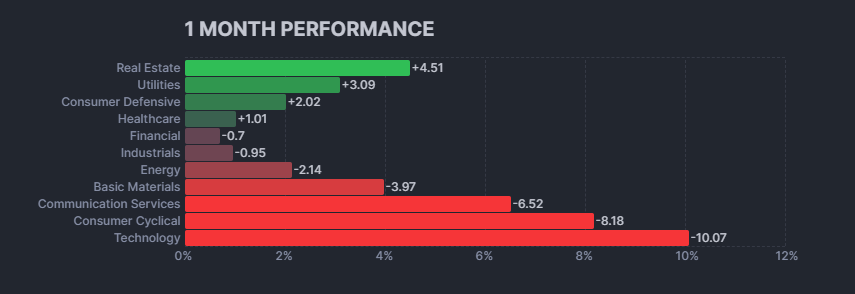
On the monthly performance, we are still seeeing the aggressive sectors getting pummeled and the defensive ones in an uptrend:
The election, a possible recession and the Yen Carry Trade are possible sources of volatility in the next months.
False Breakouts in Nikkei and Russel are big signs of trouble in my opinion.
A look at the Charts
QQQ the Bull Market Leader
It is hard to imagine that we can rally without the QQQ leading, so looking at the relative strength of QQQ vs SPY is a very important indicator to me.
Weekly QQQ:
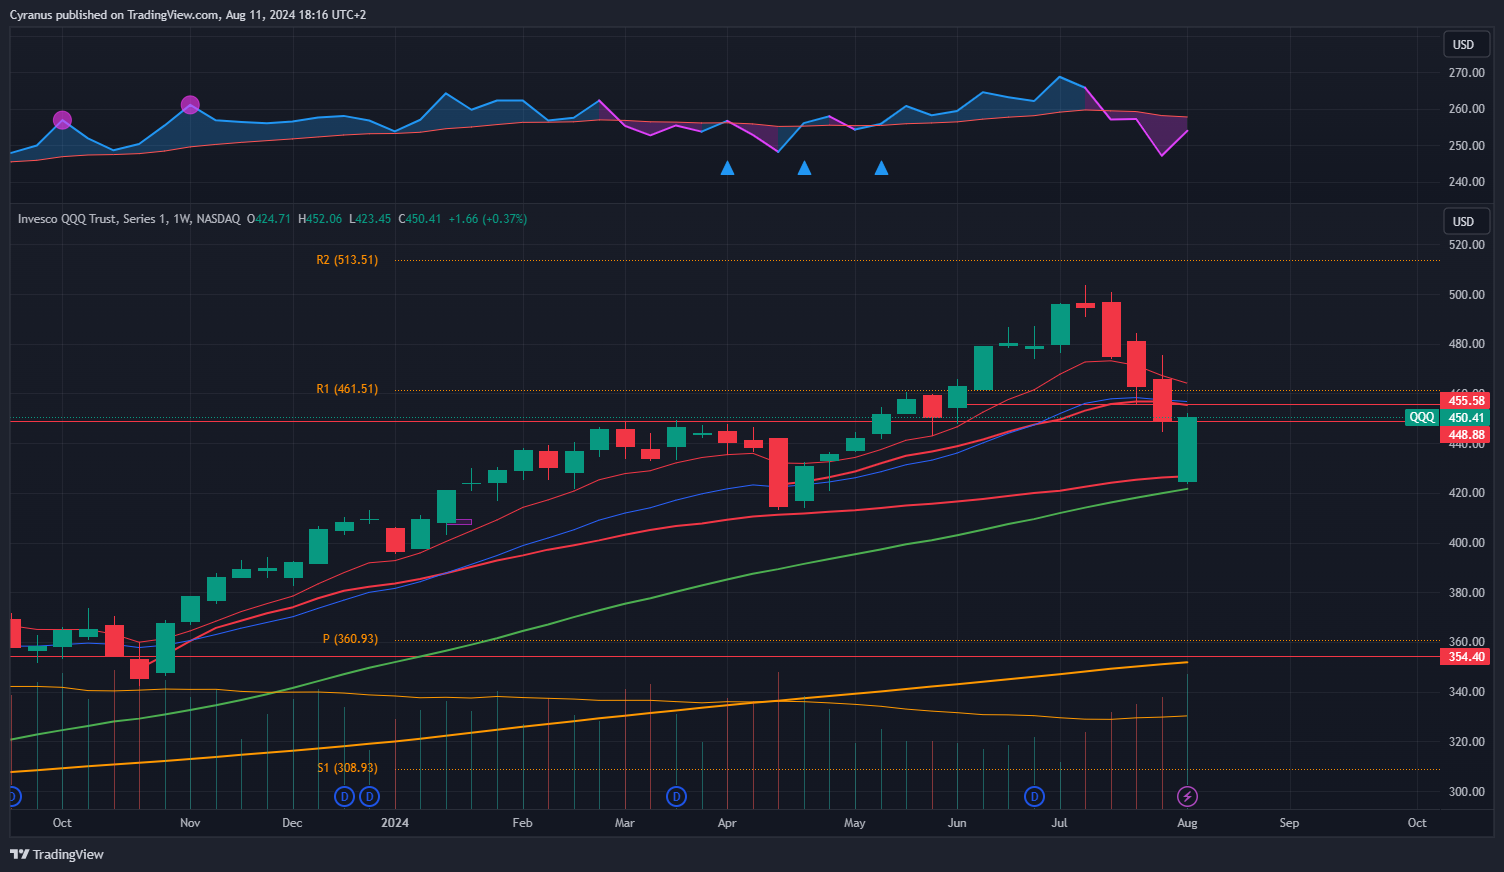
QQQ found massive support at the AVWAP from the October Low and the 50 Week Moving average, this means, that for now, the bigger weekly uptrend is still intact.
However we have stiff resistance to overcome with the AVWAP from the April Low and the 10 and 20 Week EMA curling down from above.
I am expecting a lot of chop in the next couple of weeks. We might also retest the 50MA again.
Daily QQQ:
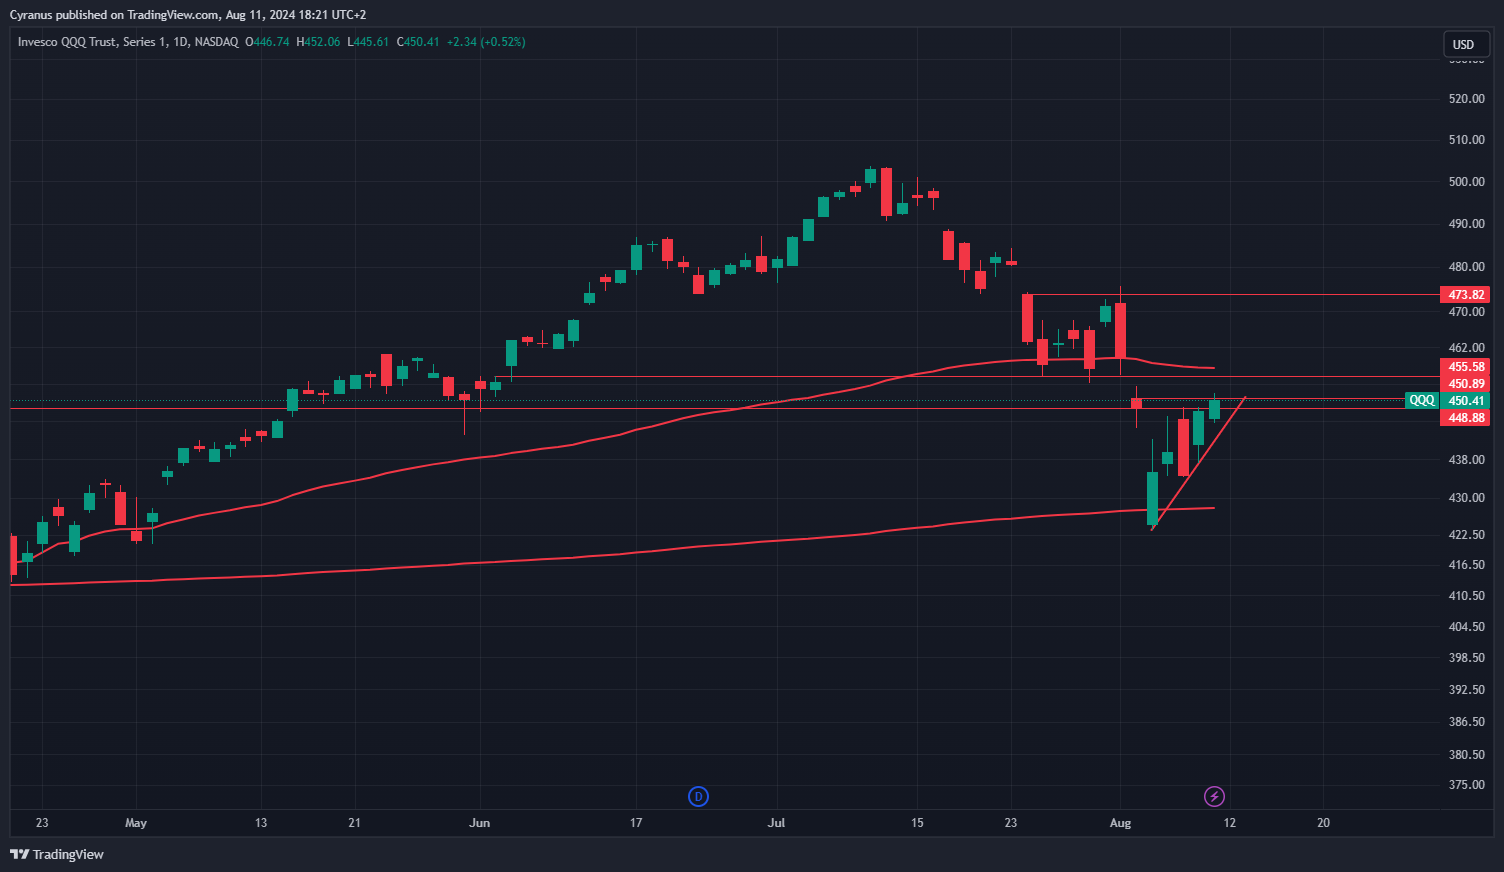
On the daily we have built a Bear flag right into heavy resistance at 450.
If we beat that level we are up against 455 and even after that we would only be in a chop zone.
Only if we can push off the 474 level I would talk about a daily uptrend again.
IWM - The Trap
After years of Underperformance all the Macro Bulls were excited about the Small Cap Breakout, following the june CPI report on July 11th. They had been wanting to go long this index for a long time, as the underperfromance against Tech stocks was just too crazy. However the breakout reversed brutally and the IWM looks awful on any timeframe.
Weekly IWM:
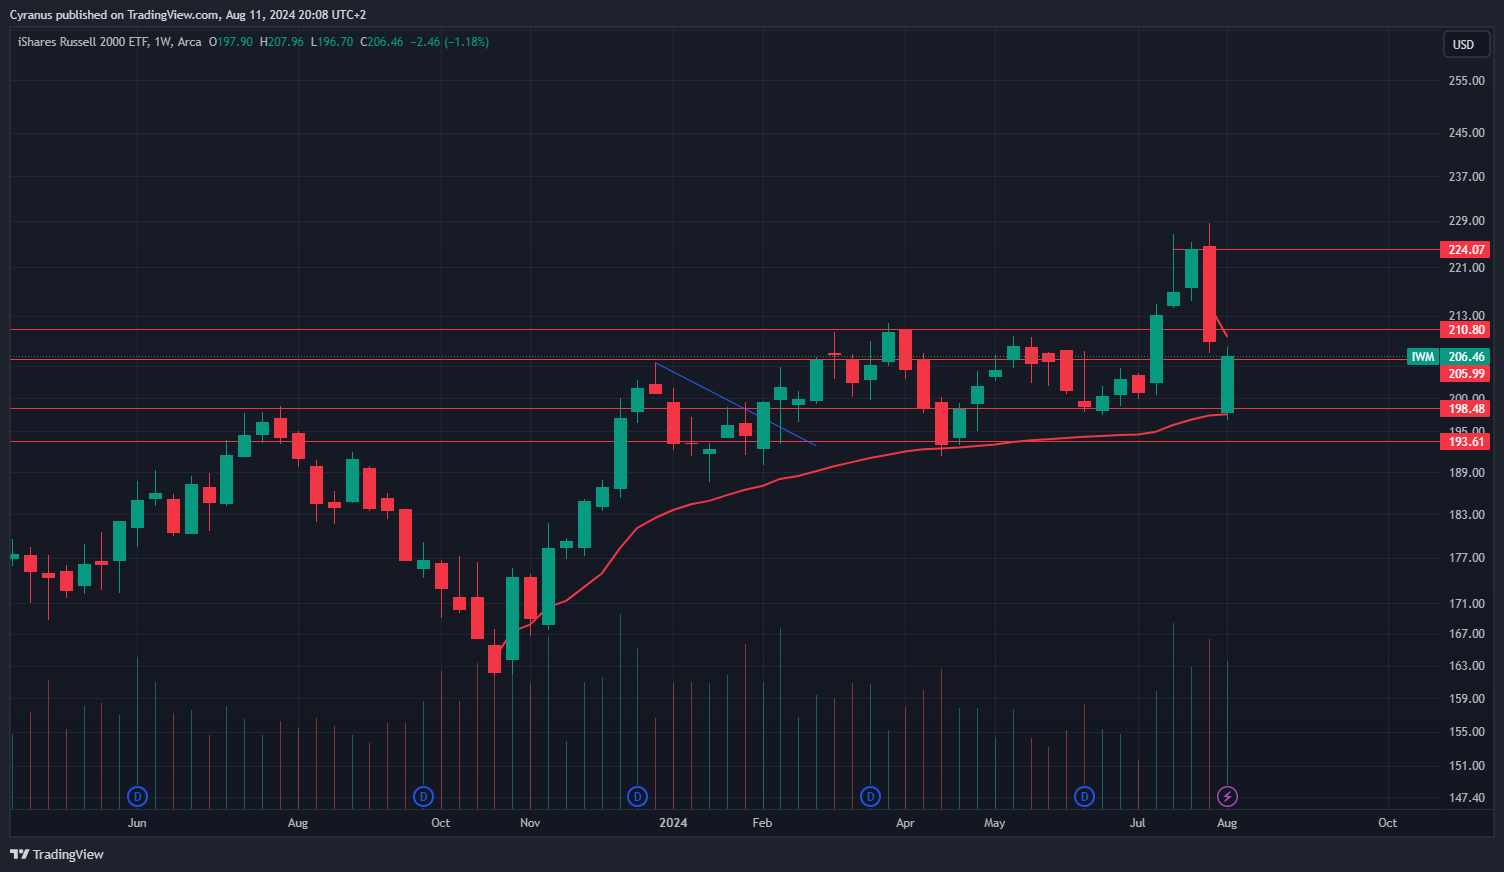
IWM for a precious two weeks had entered into an uptrend, but completely reversed on high volume.
On a positive note, the AVWAP and the 200 Week Moving Average held as support.
Daily IWM:
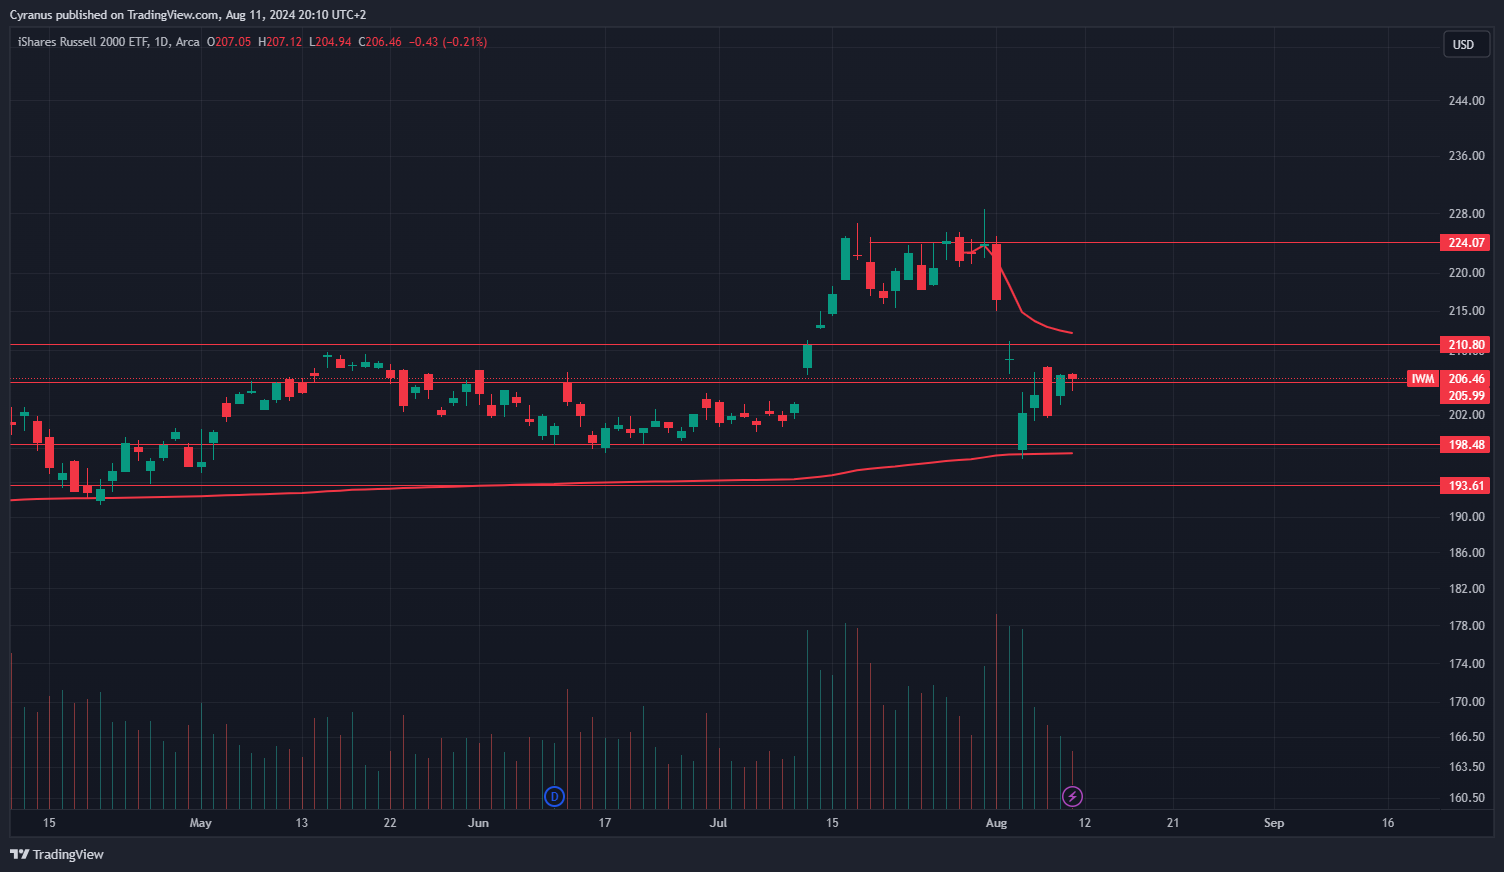
Clear view on the breakdown, where we completely filled the breakaway gap from the july 11th CPI report. We are in a Bearflag right now and even worse are back to the underperformance against the SPY and QQQ.
224 is the Level to take out.
TLT - Return of the Safe Haven
Since Inflation picked up in 2021, the classic flight to safety trade has not worked, bonds and equity were not only more correlated than in any time since the 1970s, Bonds even underperformed equity on the downside, which was a first in the US stock market history to my knowledge.
But as inflation calmed down, TLT makes a return as an inversely correlated asset to equity, especially in a sharp drawdown. I have been watching this closely and also am trading TLT very actively right now.
Weekly TLT:
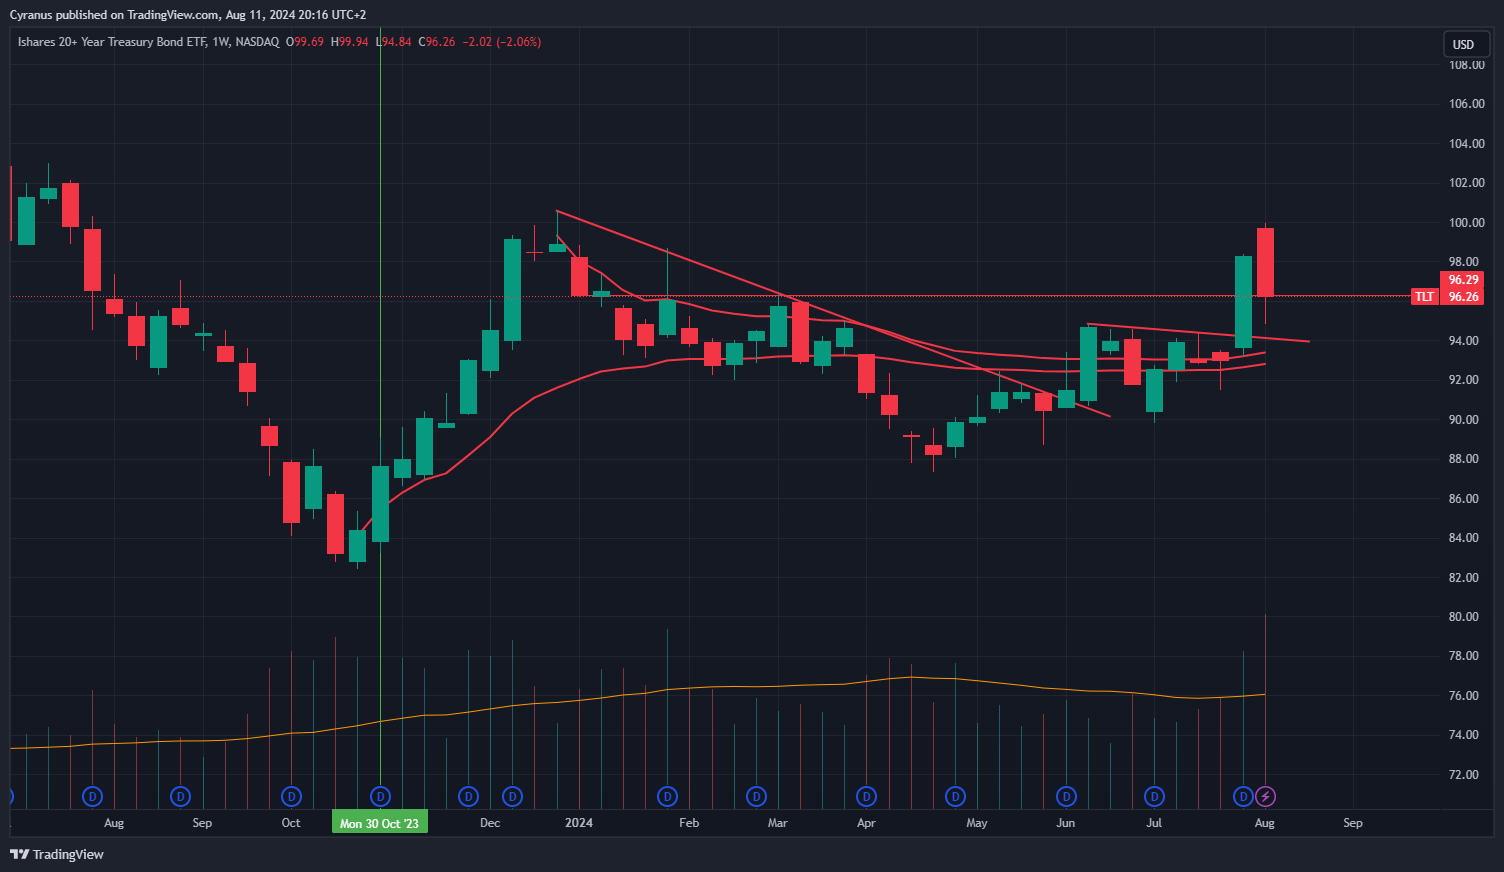
We entered an uptrend two weeks ago, when we broke out of an extended flag type consolidation. Although we had a sharp drawdown in the middle of last week, we still finished above an important price level, as seen on the daily:
Daily TLT:
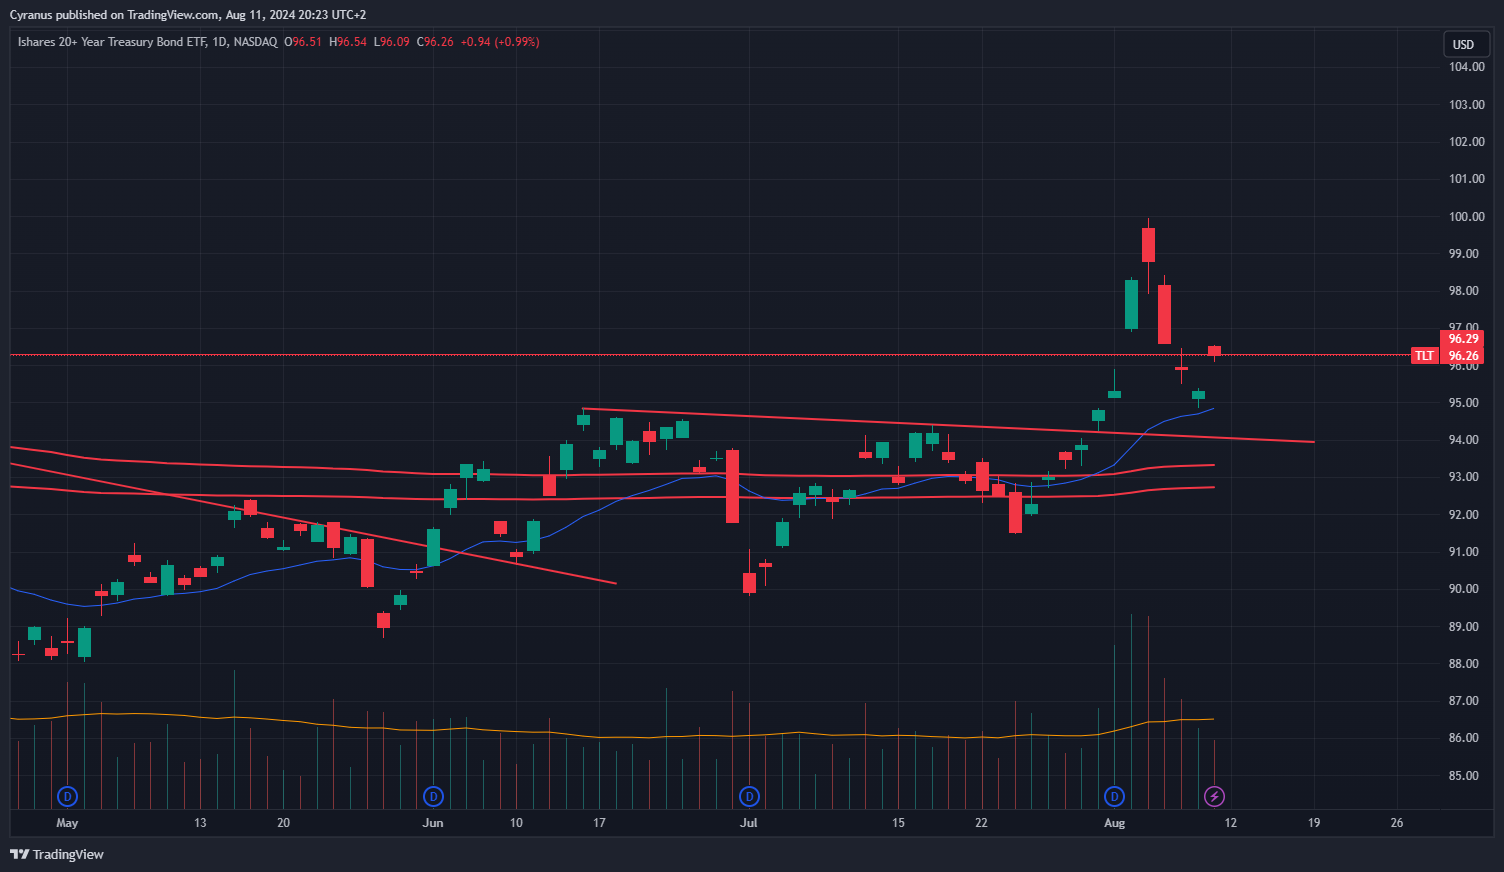
The chart looks choppy as interest rates are traded actively around the clock, but we can see the breakout and now the potentially successful backtest of the breakout.
I thought it was a great R/R trade and took a position at the 20EMA, at about the same spot where I bought the first breakout position on august first.
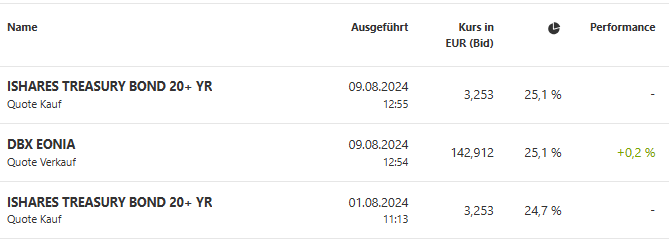
Would have been better if I had sold the other position last monday, but I just like those Bond positions in times with high volatility, and it chops around so much, that I just enter and exit on definitive breaks of big levels.
And based on what I am seeing right now, we are in weekly and daily uptrend for TLT, while TLT at the same time outperforms other Bond ETFs with shorter duration like IEF:
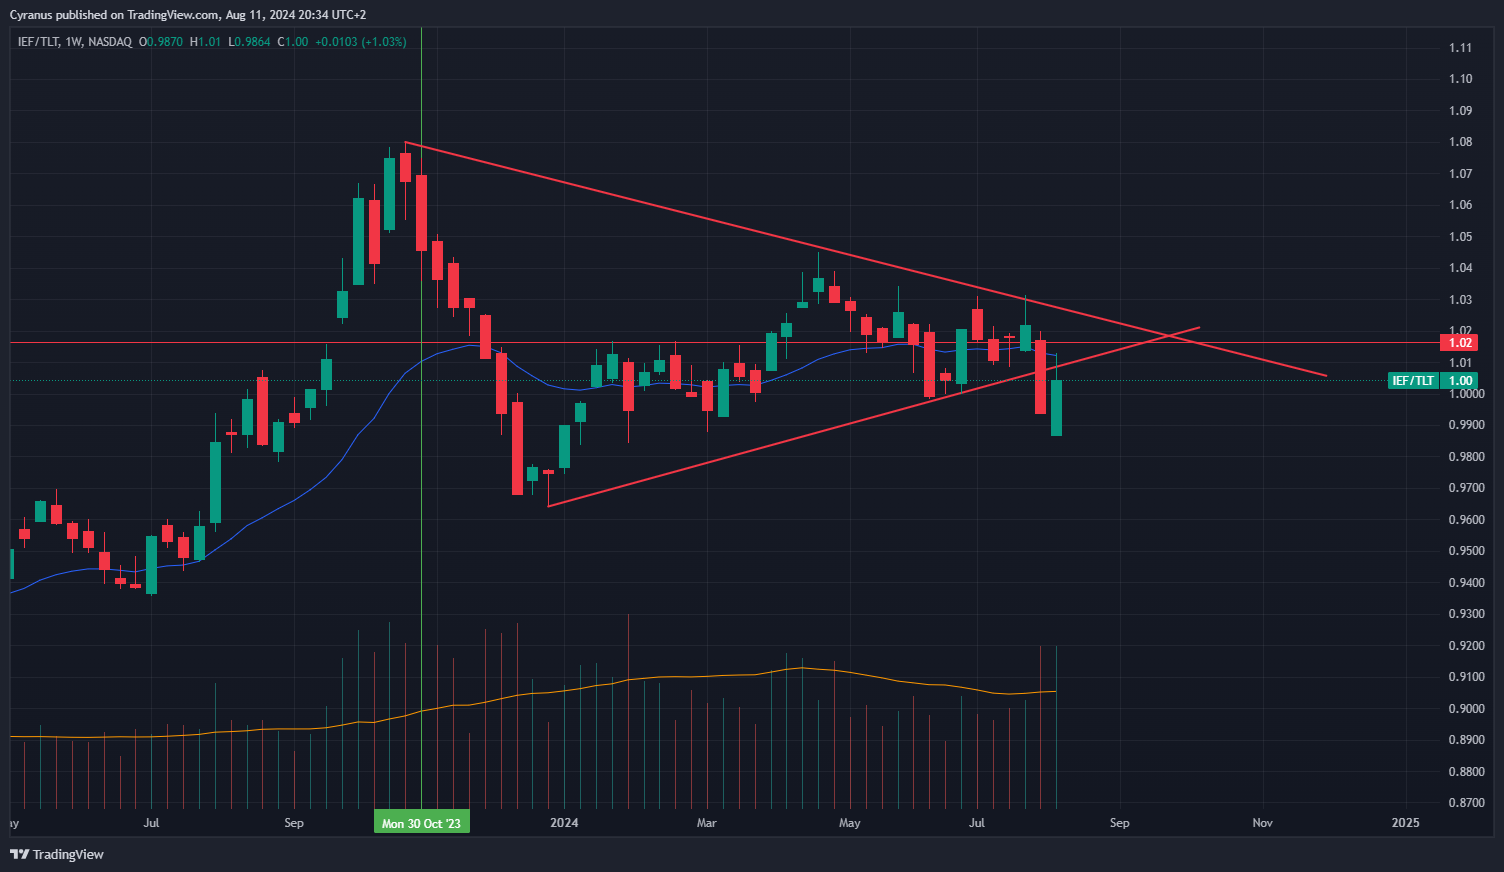
This is a Breakdown and for now successful Backtest on the IEF/TLT ratio, that indicates a potential outperformance of TLT vs SPY in the coming weeks.
Conclusion:
Stocks are in a daily downtrend and weekly in chop territory. Volatility is elevated and Long Bonds are in a negative correlation to equities again.
Also Long Bonds broke out into a weekly uptrend, holding this will be key for the next week.
If Long Bonds break down and Equities Rally again, breaking overhead resistance with Tech stocks leading, I will go back to trading William O`Neill like Momentum Breakouts.
If on the other hand we see Bonds holding up and equities chop around, I will continue to hold Cash and Long Bonds.
anything u can tell us about how u calc risk on/off on your top matrix?